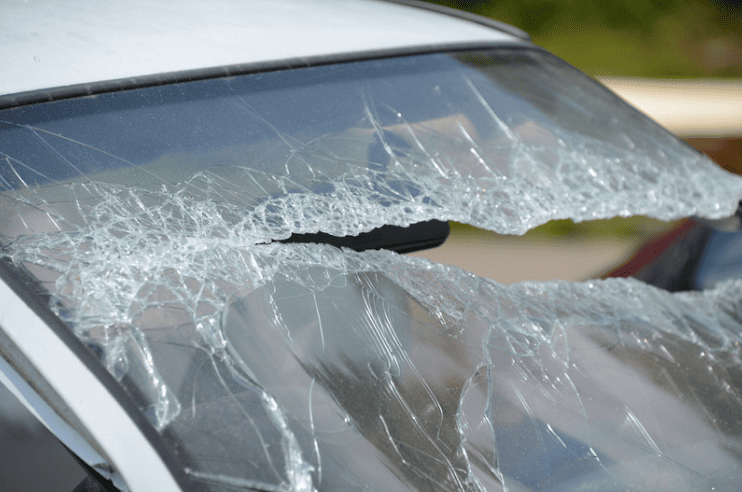
If you are wondering how many car accidents per year happen in California, the numbers tell a clear and urgent story. California consistently ranks among the states with the highest number of motor vehicle crashes and related fatalities. Based on the most recent available data from the Annual Crash Data on California State Highways, thousands of lives are lost or changed forever each year.
This data offers a closer look at how and why crashes occur on California roads. Understanding the trends in traffic deaths, injury causes, and risky behavior like impaired or distracted driving can help you recognize patterns and better understand the legal and public safety issues at stake.
Overview of California Car Accident Statistics (2021–2022)
The following table presents the most recent full-year statistics from California’s Annual Collision Data report. It includes total traffic deaths and breakdowns by cause and type of road user.
California Traffic Fatality Statistics (2021–2022)
| Category | 2021 | 2022 |
| Total Traffic Fatalities (CA) | 4,285 | 4,407 |
| Alcohol-Impaired Fatalities | 1,370 | 1,285 |
| Unrestrained Occupant Fatalities | 878 | 855 |
| Motorcyclist Fatalities | 565 | 576 |
| Unhelmeted Motorcyclist Fatalities | 37 | 35 |
| Teen Motor Vehicle Fatalities | 243 | 230 |
| Teen Driver Fatalities | 130 | 122 |
| Pedestrian Fatalities | 1,108 | 1,093 |
| Bicyclist Fatalities | 125 | 117 |
| Drug-Impaired Driving (Tested Positive) | 52.9% | 53.5% |
California General Crash Statistics (2021–2022)
| Crash Type | 2021 | 2022 |
| Total Crashes (All Severities) | 162,388 | 163,524 |
| Injury Crashes | 111,309 | 110,047 |
| Property Damage Only Crashes | 38,741 | 40,296 |
| Pedestrian-Involved Crashes | 12,215 | 12,379 |
| Bicycle-Involved Crashes | 9,806 | 9,445 |
These numbers reflect full-year reporting and are the only statewide statistics available for California highway crashes. Each category reveals a different risk factor contributing to traffic deaths and injuries.
Alcohol and Drug Impairment Remain Major Risk Factors
Alcohol-related deaths continue to account for a significant portion of California’s total traffic fatalities. In 2021, there were 1,370 alcohol-impaired driving fatalities, an increase of 16.1 percent from the prior year. These crashes accounted for 32 percent of all traffic deaths statewide. Drug-impaired driving remains another leading concern. Of the drivers killed in California traffic accidents in 2021 and tested for substances, 52.9 percent tested positive for legal or illegal drugs. That figure is slightly lower than the previous year, but still shows how common drug involvement remains in fatal crashes. These forms of impairment, whether from alcohol, prescription medication, or illicit substances, continue to endanger drivers, passengers, and pedestrians across the state.
Seatbelt Use and Occupant Safety Declines
The number of unrestrained passenger vehicle occupant fatalities rose by 12.2 percent from 2020 to 2021. A total of 878 individuals died without wearing a seatbelt. These deaths often occur in high-speed crashes or rollovers where safety restraints could have made a difference. Failure to wear a seatbelt remains one of the most preventable causes of death in car accidents. These numbers emphasize why enforcement efforts continue to focus on seatbelt compliance throughout California.
Motorcycle and Teen Driver Trends
Motorcycle fatalities increased slightly, from 549 in 2020 to 565 in 2021. Notably, unhelmeted motorcycle deaths also rose, climbing to 37 in 2021. These figures suggest that risks to motorcyclists remain high despite education and helmet laws. Teen motor vehicle fatalities also climbed during the same period. In 2021, 243 teens aged 16 to 19 were killed in traffic crashes, up 9.5 percent from the year before. Among those, 130 were teen drivers. These statistics show that inexperience and risk-taking behavior still contribute to fatal accidents involving young drivers.
Pedestrian and Bicycle Deaths Show Mixed Results
Pedestrian fatalities increased by 9.3 percent in 2021, with 1,108 deaths reported across the state. Urban and suburban areas see the highest pedestrian risk, especially in poorly lit intersections or crosswalks that are poorly marked.
In contrast, bicyclist fatalities decreased by 8 percent. There were 125 deaths in 2021, down from 136 in 2020. While this is a modest improvement, it highlights the ongoing vulnerability of cyclists in shared traffic environments.
Distracted Driving and Human Error Still Play a Role
Distracted driving is often underreported but remains a known contributor to crashes. National research points to three types of distraction: visual, manual, and cognitive. In California, drivers between the ages of 20 and 39 are most likely to be involved in distraction-related fatal crashes. This includes looking at phones, handling objects, or mentally disconnecting from the road. Despite California’s laws restricting phone use while driving, enforcement challenges and in-vehicle technology complicate the issue. Reducing distraction remains a critical safety focus.
These statistics reflect more than just numbers. They show how driver behavior, safety measures, and road conditions continue to shape outcomes on California highways. Understanding these patterns can inform policy, prevention, and personal responsibility behind the wheel.
What These Numbers Mean for You
These California car accident statistics highlight more than trends—they reflect the real risks people face on California roads every day. If you or someone you love has been injured in a car accident, working with a Sacramento car crash lawyer who understands the full scope of these issues can make a real difference. At the Law Offices of Ali Yousefi, P.C., we use data, strategy, and experience to help accident victims recover what they deserve. Give us a call today to schedule a free consultation.


